View Cluster Metrics
- Capella Operational
- concept
Couchbase Capella provides metrics for each cluster so you can discover and trend cluster performance.
The metrics available on the Monitoring dashboard provide insight into cluster performance and can help identify runtime outliers. This dashboard can also help you investigate intermittent issues with adjustable timeframes, drag to zoom, and viewing multiple metrics on one page. You can customize the Monitoring dashboard to only track the metrics you want.
View the Monitoring Dashboard
With a cluster open:
-
Go to Monitoring.
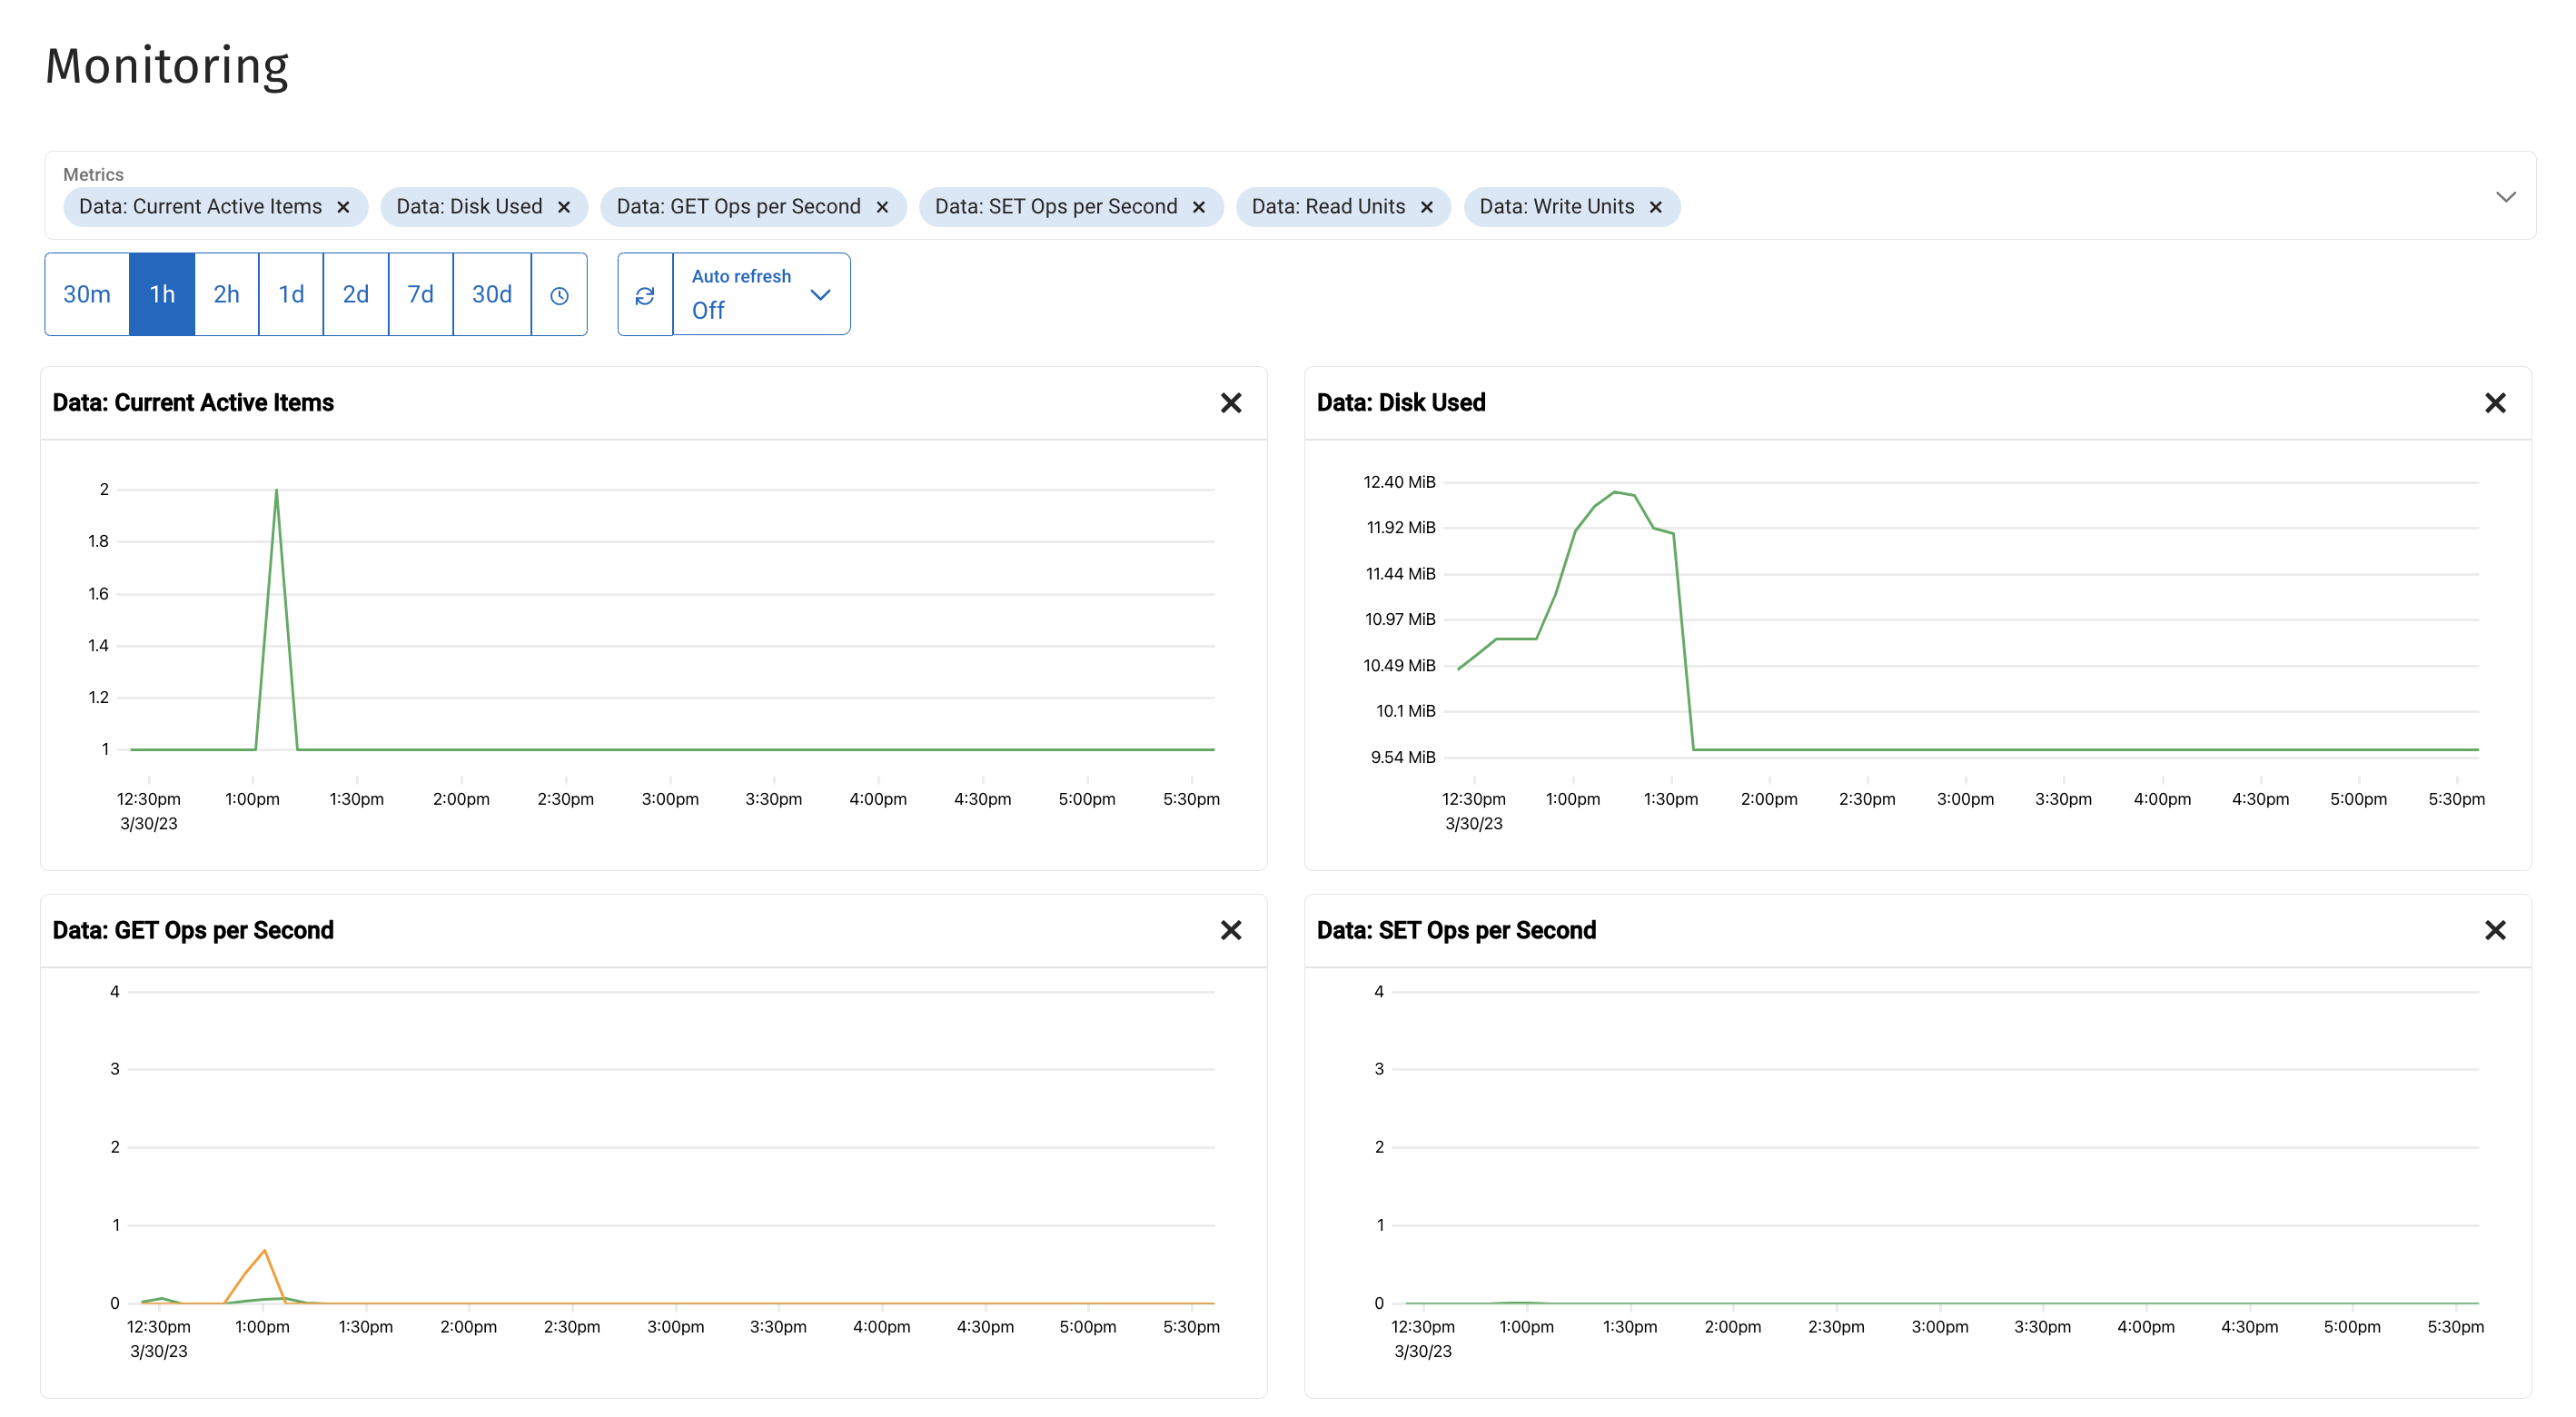
This dashboard provides a customizable collection of metrics for the current cluster.

| The Choose Metrics message appears when the Monitoring dashboard has no added metrics. Select the Data Service or All Metrics link to populate the dashboard with a default metrics set. |
The Monitoring dashboard includes the following elements:
| Element | Description |
|---|---|
Metrics |
Near the top of the Monitoring dashboard is the Metrics list, which includes every available metric. Use the Metrics list to add or remove a metric by selecting its entry. |
Timeframe |
The timeframe filters allow you to switch between preselected timeframes moving backward from the current time or a custom timeframe. The Auto-refresh option is off by default. When turned on, it refreshes the dashboard with the most recent data based on the chosen refresh rate—1m or 2m. Auto-refresh is only available with the 30m, 1h, or 2h timeframe options. |
Metric tile |
The Monitoring dashboard shows each metric as a tile. A tile includes a title, a graph with labeled X and Y axis, and data lines. |
Using Metrics
Each metric tile on the Monitoring dashboard shows you a chart representing data from the chosen timeframe.
|
Chart resolution
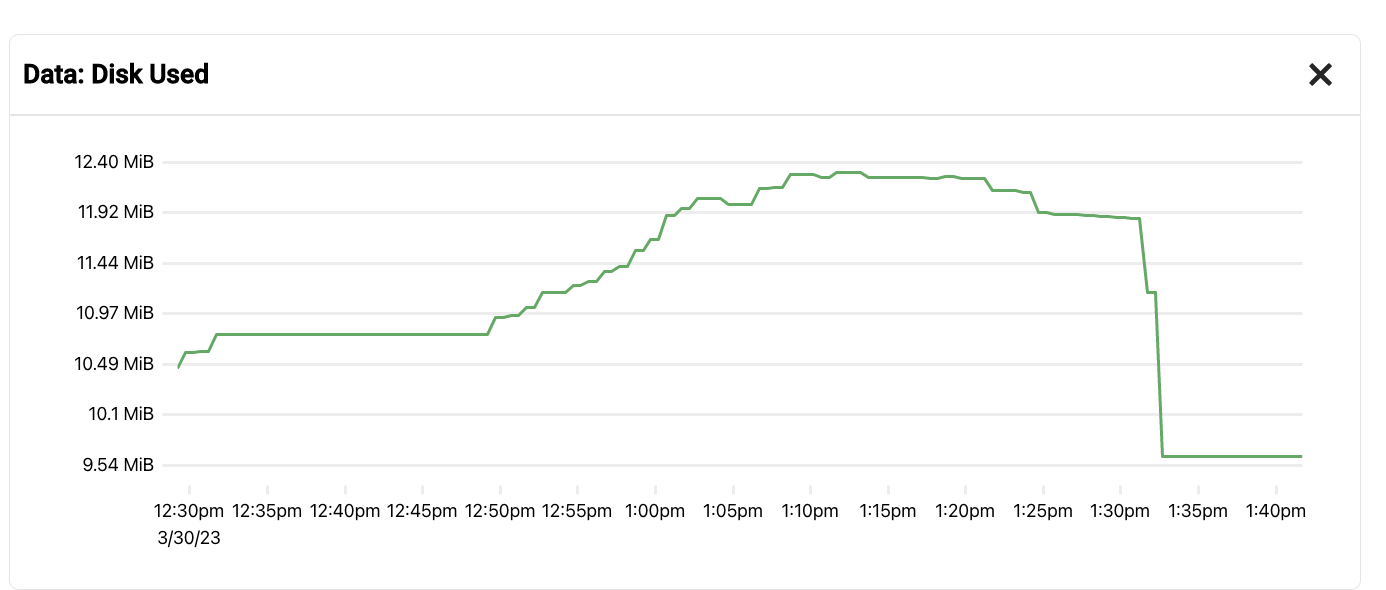
Capella draws metrics charts down to 60-second (1-minute) resolution. This resolution is available for graphs using the 30m, 1h, and 2h timeframes. When you select a longer timeframe, Capella automatically adjusts the chart data resolution. These chart data resolutions are:
|
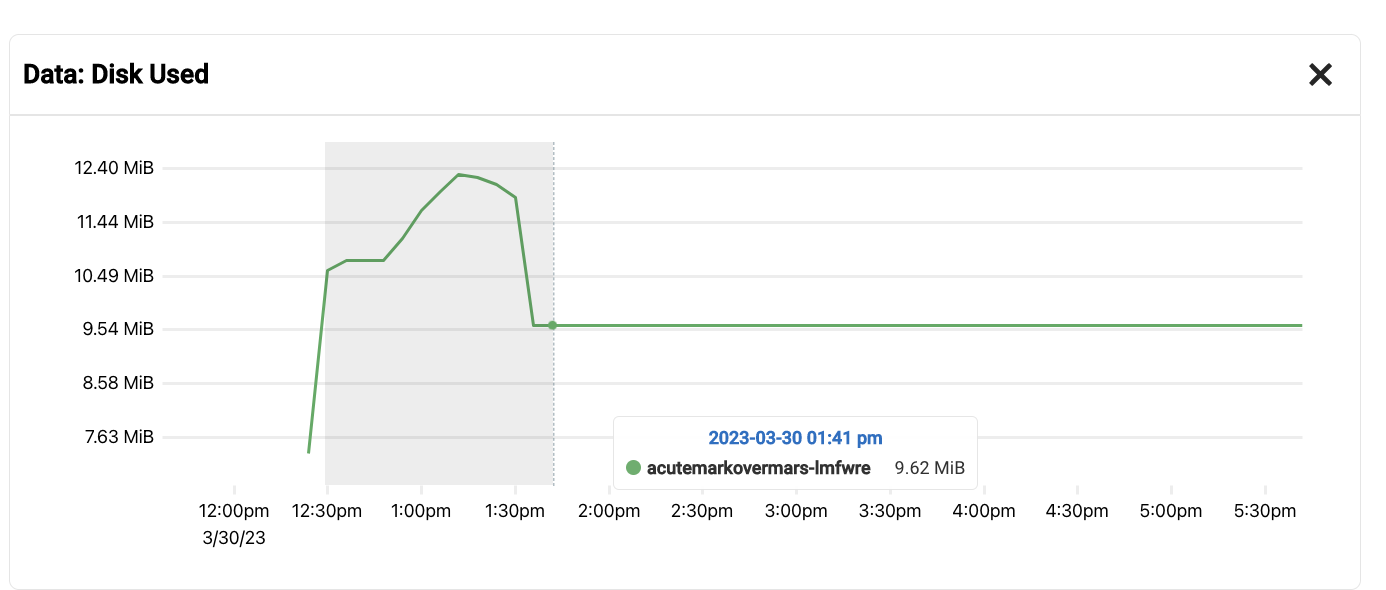
Moving your mouse pointer over a metric chart provides date, time, and resource information for the part of the chart you are pointing at. You can also zoom in on areas of a chart by dragging your pointer over the region you want to focus on.

Zooming in on a chart updates the timeframe to match your current selection for all metrics on the dashboard.

Add Metrics
You can customize the Monitoring dashboard to mix and match the metrics you want to track.
To add metrics to the Monitoring dashboard:
-
In the Metrics list, select the metric you want to display.
Repeat this step to add multiple metrics.
The Monitoring dashboard adds new metric tiles to the bottom of the page.
Remove Metrics
To remove metrics from your Monitoring dashboard:
-
On the metric tile you want to remove, click Close ().
-
In the Metrics list, next to the name of the metric you want to remove, click Close ().
-
In the Metrics list, select the metric that you want to remove. Metrics appear highlighted when on the dashboard.
Choose Timeframes
By default, the Monitoring dashboard shows metric data from the past hour. Using the timescale buttons, you can choose from the following preselected timeframes:
-
30 minutes
-
1 hour
-
2 hour
-
1 day
-
2 days
-
7 days
-
30 days
You can also choose to show data from a timeframe you specify. Specifying a timeframe is most helpful when examining metrics over an event.
To specify a timeframe:
-
Click the clock icon ().
-
Select the From date and time picker and choose a date and time from when you want to start showing activity.
The Metrics dashboard automatically refreshes in the background for the new date.
-
Use the To date and time picker to update the end date and time.
By default, the To date is the current date and time.
-
With a timeframe chosen, select a blank area of the Monitoring dashboard to close the open date and time picker.
You can return to the default timeframe by selecting the 1hr option.